Code
import matplotlib.pyplot as plt
import requests
from PIL import Image
import io
import numpy as np
import matplotlib.offsetbox as obMake your data visualizations more engaging with emoji labels! Perfect for categorical data and presentations. 🎨📊
Make sure all of these lines are at the top of your notebook:
import matplotlib.pyplot as plt
import requests
from PIL import Image
import io
import numpy as np
import matplotlib.offsetbox as obAdd these functions as new cells before you do any work with emojis.
def get_emoji_image(emoji, transparent_bg=True):
    """
    Download an emoji image from online sources and return as numpy array.

    Parameters:
    - emoji: str - A single emoji character (e.g., "😀", "🔥", "👍")
    - transparent_bg: bool - If True, makes background transparent

    Returns:
    - numpy array with shape (72, 72, 4) for RGBA or (72, 72, 3) for RGB
    """
    # Convert emoji to Unicode codepoint(s)
    # Handle multi-character emojis (e.g., emoji + variation selector)
    codepoints = []
    for char in emoji:
        codepoints.append(hex(ord(char))[2:].lower())

    # Join with underscores for multi-character emojis
    codepoint = "_".join(codepoints)

    # Try multiple emoji sources
    # Look for google emojis first; twitter emojis are 🤮
    urls = [
        f"https://github.com/googlefonts/noto-emoji/raw/main/png/72/emoji_u{codepoint}.png",
        f"https://raw.githubusercontent.com/twitter/twemoji/master/assets/72x72/{codepoint}.png"
    ]

    # If multi-character, also try just the first character (base emoji)
    if len(codepoints) > 1:
        base_codepoint = codepoints[0]
        urls.extend([
            f"https://github.com/googlefonts/noto-emoji/raw/main/png/72/emoji_u{base_codepoint}.png",
            f"https://raw.githubusercontent.com/twitter/twemoji/master/assets/72x72/{base_codepoint}.png"
        ])

    for url in urls:
        try:
            response = requests.get(url, timeout=5)
            if response.status_code == 200:
                img = Image.open(io.BytesIO(response.content))

                # Keep transparency if it exists and requested
                if transparent_bg and img.mode in ('RGBA', 'LA'):
                    return np.array(img)  # Keep alpha channel
                elif transparent_bg:
                    # Convert to RGBA and make white pixels transparent
                    img = img.convert('RGBA')
                    data = np.array(img)

                    # Make white/light pixels transparent
                    light_threshold = 240
                    mask = (data[:, :, 0] > light_threshold) & \
                           (data[:, :, 1] > light_threshold) & \
                           (data[:, :, 2] > light_threshold)
                    data[mask, 3] = 0  # Set alpha to 0 (transparent)

                    return data
                else:
                    # No transparency requested
                    return np.array(img.convert('RGB'))
        except:
            continue

    # Fallback: create a colored square
    if transparent_bg:
        img = Image.new('RGBA', (72, 72), color=(200, 200, 200, 255))
    else:
        img = Image.new('RGB', (72, 72), color=(200, 200, 200))
return np.array(img)def display_emoji_image(emoji):
"""
Display a single emoji image for testing.
Parameters:
- emoji: str - Single emoji character to display
"""
print(f"Getting image for: {emoji}")
# Get the emoji image
img_array = get_emoji_image(emoji)
# Display it
plt.figure(figsize=(0.5, 0.5))
plt.imshow(img_array)
plt.axis('off')
plt.tight_layout()
plt.show()
print(f"Image shape: {img_array.shape}")def emoji_labels(ax, ticks, emojis, zoom=0.8, y_offset=-18):
"""
Replace x-axis tick labels with emoji images.
Parameters:
- ax: matplotlib axis object to modify
- ticks: array-like tick positions (e.g., [0, 1, 2, 3])
- emojis: list of emoji characters (same length as ticks)
- zoom: float, emoji size scaling (try 0.5-1.2)
- y_offset: int, vertical positioning (negative = lower)
"""
# Clear default text labels
ax.set_xticks(ticks)
ax.set_xticklabels([])
# Add emoji images at each tick
for xi, e in zip(ticks, emojis):
img = get_emoji_image(e, transparent_bg=True)
oi = ob.OffsetImage(img, zoom=zoom)
ab = ob.AnnotationBbox(
oi,
(xi, 0),
xybox=(0, y_offset),
frameon=False,
boxcoords="offset points",
pad=0
)
ax.add_artist(ab)# Sample data
emojis = ["😀", "😂", "😍", "🔥", "👍"]
values = [10, 25, 15, 30, 20]
x = np.arange(len(values))
# Create plot
fig, ax = plt.subplots(figsize=(6, 4), dpi=150)
ax.bar(x, values)
# Add emoji labels
emoji_labels(ax, ticks=x, emojis=emojis)
ax.set_ylabel("Usage count")
ax.set_title("Emoji Usage")
plt.show()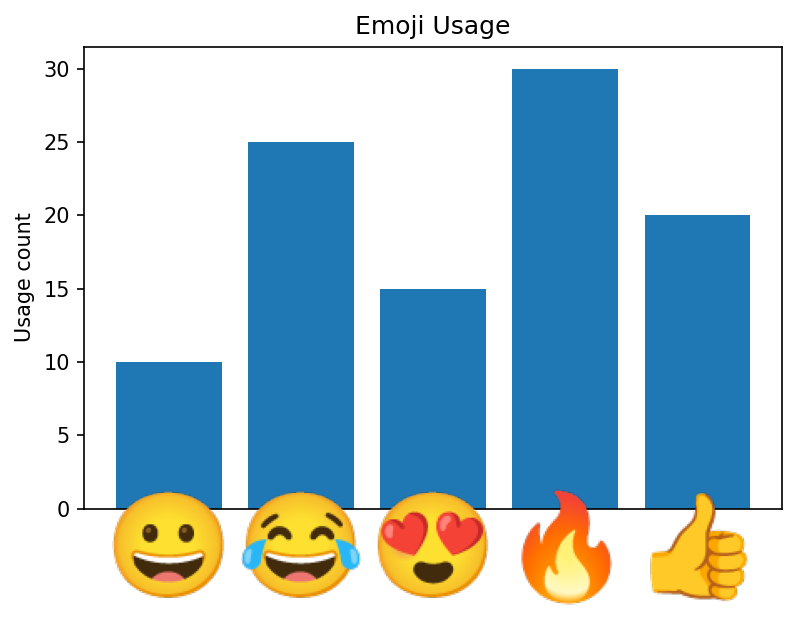
# Weather data
days = ["Mon", "Tue", "Wed", "Thu", "Fri", "Sat", "Sun"]
temps = [22, 25, 18, 30, 28, 24, 26]
weather_emojis = ["☀️", "🌤️", "🌧️", "🔥", "☀️", "⛅", "🌞"]

x = np.arange(len(days))

# Create plot
fig, ax = plt.subplots(figsize=(8, 5))
ax.plot(x, temps, marker='o', linewidth=2, markersize=8)

# Add emoji labels
emoji_labels(ax, ticks=x, emojis=weather_emojis, zoom=1.0)

ax.set_ylabel("Temperature (°C)")
ax.set_title("Weekly Weather Forecast")
ax.grid(True, alpha=0.3)
plt.tight_layout()
plt.show()
/var/folders/bs/x9tn9jz91cv6hb3q6p4djbmw0000gn/T/ipykernel_40308/461894929.py:18: UserWarning: Tight layout not applied. The bottom and top margins cannot be made large enough to accommodate all Axes decorations.
plt.tight_layout()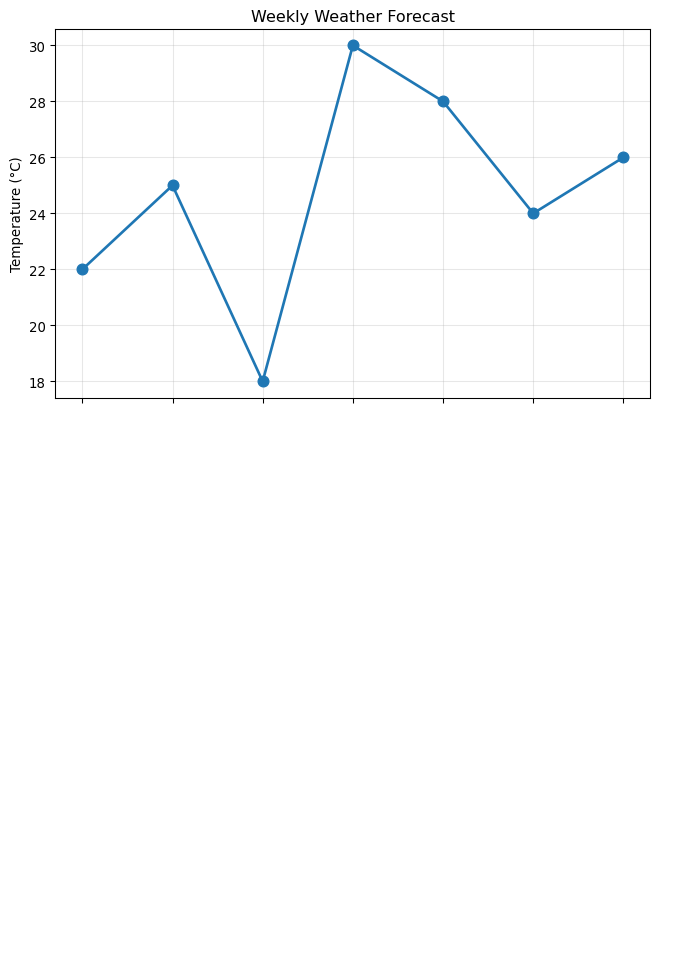
First, let’s test if emoji downloading is working at all:
# Test simple single-character emojis first
print("Testing simple emojis:")
simple_test = ["🔥", "🐍", "📊", "🎉", "⭐"]

for emoji in simple_test:
    print(f"\nTesting {emoji}:")
    img_array = get_emoji_image(emoji)
    print(f"  Shape: {img_array.shape}")
    print(f"  Data range: {img_array.min():.1f} to {img_array.max():.1f}")
    print(f"  Non-zero pixels: {np.count_nonzero(img_array)}")
Testing simple emojis:
Testing 🔥:
Shape: (72, 72, 4)
Data range: 0.0 to 255.0
Non-zero pixels: 8792
Testing 🐍:
Shape: (72, 72, 4)
Data range: 0.0 to 255.0
Non-zero pixels: 8668
Testing 📊:
Shape: (72, 72, 4)
Data range: 0.0 to 255.0
Non-zero pixels: 18567
Testing 🎉:
Shape: (72, 72, 4)
Data range: 0.0 to 255.0
Non-zero pixels: 9661
Testing ⭐:
Shape: (72, 72, 4)
Data range: 0.0 to 255.0
Non-zero pixels: 8742# Test the weather emojis specifically
print("Testing weather emojis:")
weather_test = ["☀️", "🌤️", "🌧️", "⛅", "🌞"]
for emoji in weather_test:
print(f"\nTesting {emoji}:")
img_array = get_emoji_image(emoji)
print(f" Shape: {img_array.shape}")
print(f" Data range: {img_array.min():.1f} to {img_array.max():.1f}")
print(f" Non-zero pixels: {np.count_nonzero(img_array)}")Testing weather emojis:
Testing ☀️:
Shape: (72, 72, 4)
Data range: 0.0 to 255.0
Non-zero pixels: 8444
Testing 🌤️:
Shape: (72, 72, 4)
Data range: 0.0 to 255.0
Non-zero pixels: 7824
Testing 🌧️:
Shape: (72, 72, 4)
Data range: 0.0 to 255.0
Non-zero pixels: 8952
Testing ⛅:
Shape: (72, 72, 4)
Data range: 0.0 to 255.0
Non-zero pixels: 8292
Testing 🌞:
Shape: (72, 72, 4)
Data range: 0.0 to 255.0
Non-zero pixels: 12136# Visual test - display individual emojis
print("Visual test of individual emojis:")
test_emojis = ["🔥", "🐍", "📊", "☀️", "🌧️"]
for emoji in test_emojis:
display_emoji_image(emoji)Visual test of individual emojis:
Getting image for: 🔥
Image shape: (72, 72, 4)
Getting image for: 🐍
Image shape: (72, 72, 4)
Getting image for: 📊
Image shape: (72, 72, 4)
Getting image for: ☀️
Image shape: (72, 72, 4)
Getting image for: 🌧️
Image shape: (72, 72, 4)# If emojis are cut off at the bottom:
plt.subplots_adjust(bottom=0.2) # Add bottom margin
# Or use tight_layout:
plt.tight_layout()
# Adjust emoji size if too big/small:
emoji_labels(ax, ticks=x, emojis=emojis, zoom=0.6) # Smaller
emoji_labels(ax, ticks=x, emojis=emojis, zoom=1.2) # Larger<Figure size 672x480 with 0 Axes># Move emojis further down:
emoji_labels(ax, ticks=x, emojis=emojis, y_offset=-25)
# Move emojis closer to axis:
emoji_labels(ax, ticks=x, emojis=emojis, y_offset=-10)# Check if emoji downloaded successfully:
img_array = get_emoji_image("🔥")
print(f"Shape: {img_array.shape}")
print(f"Min/Max values: {img_array.min()}, {img_array.max()}")
# Gray square = emoji download failed, fallback usedShape: (72, 72, 4)
Min/Max values: 0, 255# Step 1: Import libraries (run once)
import matplotlib.pyplot as plt
import requests
from PIL import Image
import io
import numpy as np
import matplotlib.offsetbox as ob
# Step 2: Copy the three functions above (run once)
# get_emoji_image(), display_emoji_image(), emoji_labels()
# Step 3: Create your data
categories = ["Category A", "Category B", "Category C", "Category D"]
values = [25, 40, 30, 35]
emojis = ["🎯", "🚀", "💡", "🏆"] # Choose your emojis
x = np.arange(len(categories))
# Step 4: Create plot
fig, ax = plt.subplots(figsize=(8, 6))
ax.bar(x, values, color=['#FF6B6B', '#4ECDC4', '#45B7D1', '#96CEB4'])
# Step 5: Add emoji labels
emoji_labels(ax, ticks=x, emojis=emojis)
# Step 6: Customize plot
ax.set_ylabel("Values")
ax.set_title("My Emoji Plot")
ax.grid(axis='y', alpha=0.3)
plt.tight_layout()
plt.show()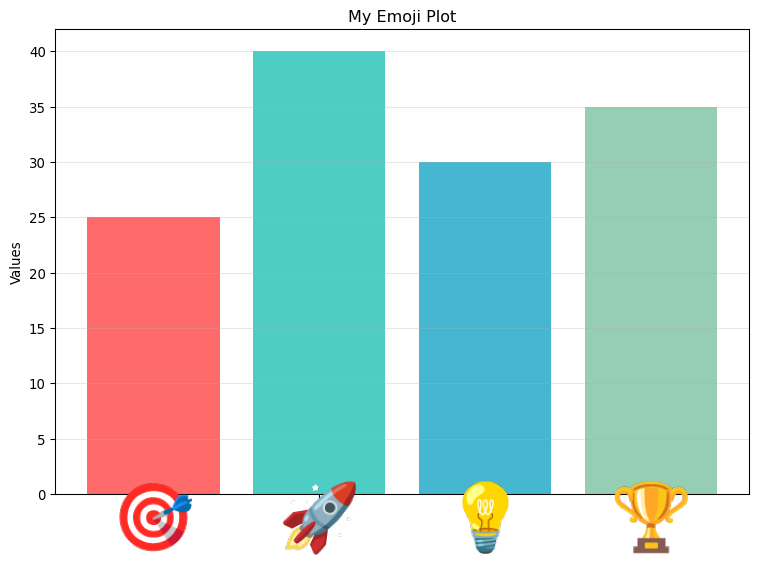
Internet Connection Required: Emojis are downloaded from online sources. If offline, gray squares will appear as placeholders.
Multi-Character Emojis: Some emojis like “☀️” are actually composed of multiple Unicode characters (base emoji + variation selector). The function now handles these automatically, but if you encounter issues, try the simpler versions like “☀” instead of “☀️”.